Marvelous Misadventures in Bioinformatics
A blog on some snippets of my work in bioinformatics. Hopefully you find something useful here and avoid stupid mistakes I made.
Plotting MSA
Pymsaviz is a great local and offline multiple sequence alignment (MSA) viewer and plotter alternative to the NCBI online MSA viewer. No frills, easy to install and use and is fantastic for creating publication-grade figures.
I will be using this example to visulise the alignment.
Prerequisite
- Python >= 3.9
Installation
pip install pygenomeviz
or
conda install -c conda-forge -c bioconda pymsaviz
Usage
- Import package
from pymsaviz import MsaViz - Assuming you have run a MSA with an output file called
msa.out.fain the same directorymsa_file = "./msa.out.fa" - Create the MSA object.
mv = MsaViz(msa_file, wrap_length=60, show_count=True) - Plot and Save.
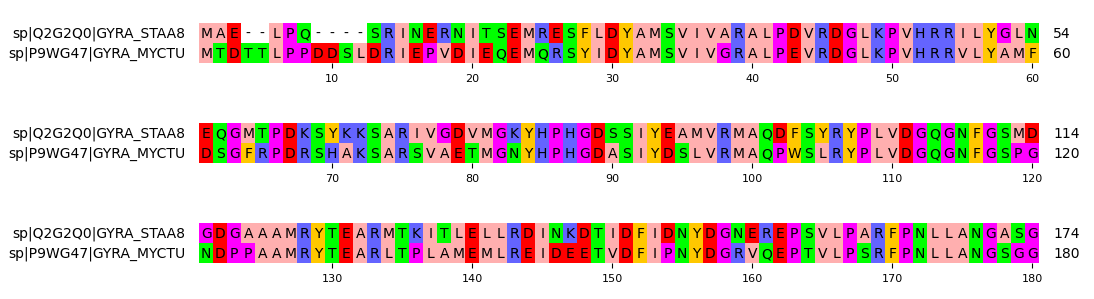
mv.savefig("./msa_plot.png")
You should see an output like this. (excerpt)